
Del Sol-Loma Linda, Texas
Del Sol-Loma Linda, Texas | |
|---|---|
former CDP | |
 | |
| Coordinates: 28°0′55″N 97°30′47″W / 28.01528°N 97.51306°W | |
| Country | United States |
| State | Texas |
| County | San Patricio |
| Area | |
| • Total | 2.8 sq mi (7.2 km2) |
| • Land | 2.8 sq mi (7.2 km2) |
| • Water | 0.0 sq mi (0.0 km2) |
| Population (2000) | |
| • Total | 726 |
| • Density | 262.3/sq mi (101.3/km2) |
| Time zone | UTC-6 (Central (CST)) |
| • Summer (DST) | UTC-5 (CDT) |
| FIPS code | 48-19810[1] |
Del Sol-Loma Linda is a census-designated place (CDP) in San Patricio County, Texas, United States. The population was 726 at the 2000 U.S. Census.
The Del Sol-Loma Linda CDP, active in the 200 census,[2] was deleted in the 2010 census and parts taken to form three new CDPs: Del Sol,[3] La Paloma Addition,[4] and Loma Linda CDPs.[5][6]
Geography[edit]
Del Sol-Loma Linda is located at 28°0′55″N 97°30′47″W / 28.01528°N 97.51306°W (28.015334, -97.512943).[7]
According to the United States Census Bureau, the CDP has a total area of 2.8 square miles (7.3 km2), all land.
Demographics[edit]
As of the census[1] of 2000, there were 726 people, 209 households, and 175 families residing in the CDP. The population density was 262.3 inhabitants per square mile (101.3/km2). There were 226 housing units at an average density of 81.7 per square mile (31.5/km2). The racial makeup of the CDP was 77.13% White, 0.14% African American, 1.24% Native American, 17.63% from other races, and 3.86% from two or more races. Hispanic or Latino of any race were 87.33% of the population.
There were 209 households, out of which 48.3% had children under the age of 18 living with them, 61.2% were married couples living together, 16.7% had a female householder with no husband present, and 15.8% were non-families. 10.5% of all households were made up of individuals, and 3.8% had someone living alone who was 65 years of age or older. The average household size was 3.47 and the average family size was 3.81.
In the CDP, the population was spread out, with 34.3% under the age of 18, 10.6% from 18 to 24, 26.2% from 25 to 44, 21.8% from 45 to 64, and 7.2% who were 65 years of age or older. The median age was 30 years. For every 100 females, there were 96.2 males. For every 100 females age 18 and over, there were 99.6 males.
The median income for a household in the CDP was $30,156, and the median income for a family was $31,563. Males had a median income of $15,735 versus $21,250 for females. The per capita income for the CDP was $29,518. About 28.6% of families and 28.8% of the population were below the poverty line, including 24.1% of those under age 18 and none of those age 65 or over.
Education[edit]
Del Sol-Loma Linda is served by the Sinton Independent School District.[8]
References[edit]
- ^ a b "U.S. Census website". United States Census Bureau. Retrieved January 31, 2008.
- ^ "CENSUS 2000 BLOCK MAP: DEL SOL−LOMA LINDA CDP" (PDF). U.S. Census Bureau. Retrieved February 16, 2024.
- ^ "2010 CENSUS - CENSUS BLOCK MAP: Del Sol CDP, TX" (PDF). U.S. Census Bureau. Retrieved February 16, 2024.
- ^ "2010 CENSUS - CENSUS BLOCK MAP: La Paloma Addition CDP, TX" (PDF). U.S. Census Bureau. Retrieved February 16, 2024.
- ^ "2010 CENSUS - CENSUS BLOCK MAP: Loma Linda CDP, TX" (PDF). U.S. Census Bureau. Retrieved February 16, 2024.
- ^ "Population and Housing Unit Counts, 2010 Census of Population and Housing" (PDF). Texas: 2010.
- ^ "US Gazetteer files: 2010, 2000, and 1990". United States Census Bureau. February 12, 2011. Retrieved April 23, 2011.
- ^ "2020 CENSUS - SCHOOL DISTRICT REFERENCE MAP: San Patricio County, TX" (PDF). U.S. Census Bureau. Retrieved February 15, 2024. - Text list - 2010 map and 2010 list. Both maps show Del Sol and Loma Linda as separate CDPs.
Municipalities and communities of San Patricio County, Texas, United States | ||
|---|---|---|
| Cities | 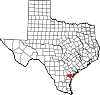 | |
| Towns | ||
| CDPs | ||
| Unincorporated community | ||
| Footnotes | ‡This populated place also has portions in an adjacent county or counties | |