Federal electoral district in Alberta, Canada
Lethbridge (formerly known as Lethbridge—Foothills ) is a federal electoral district in Alberta , Canada, that has been represented in the House of Commons of Canada since 1917. It incorporates the City of Lethbridge and Lethbridge County .
Lethbridge has had a centre-right MP at the federal level since the 1930s. The current MP for Lethbridge is Rachael Thomas , who was first elected to parliament in 2015 for the Conservatives and was re-elected in 2021 as a Conservative MP.
History [ edit ] This riding was originally created in 1914 from parts of Macleod riding.
In 1977, it was renamed "Lethbridge—Foothills".
In 1987, Lethbridge—Foothills was abolished and replaced by a new "Lethbridge" riding. The new riding was created from most of Lethbridge—Foothills, along with parts of Macleod and Medicine Hat ridings.
It has been represented by centre-right MPs without interruption since 1930. As in most other federal Alberta ridings outside of Calgary and Edmonton , it usually supports the major right-wing party of the day by landslide margins. Since 1945, a non-conservative party has only won 30 percent of the vote three times. Lethbridge itself is somewhat friendlier to centre-left candidates, at least at the provincial level, which helps reduce the overall margins compared to surrounding ridings. The Alberta New Democratic Party (NDP) won both seats in the provincial legislature from the city in the 2015 provincial election, but in 2019 lost the Lethbridge East riding to the United Conservative Party (UCP). The city has occasionally elected provincial Liberals in the past as well. At the federal level, however, the NDP and the Liberals are no match for the overwhelming conservative bent of the more rural areas.[citation needed
This riding lost territory to Medicine Hat—Cardston—Warner and Foothills during the 2012 electoral redistribution .
Historical boundaries [ edit ]
1914 representation order
1924 representation order
1933 representation order
1952 representation order
1966 representation order
1976 representation order
1987 representation order
1996 representation order
2003 representation order
2013 representation order
Members of Parliament [ edit ] Current member of Parliament [ edit ] Its member of Parliament is Rachael Thomas . She was first elected in 2015 . She is a member of the Conservative Party of Canada .
Demographics [ edit ]
Panethnic groups in Lethbridge (2011−2021)
Panethnic group
2021[3]
2016[4]
2011[5]
Pop. %
Pop.
%
Pop.
%
European [a] 96,470
95,430
90,940
Indigenous
7,240
6,135
4,370
East Asian [b] 3,415
3,030
3,135
Southeast Asian [c] 3,220
2,465
1,210
African
3,220
1,925
855
South Asian
3,075
2,135
965
Latin American
2,390
1,665
710
Middle Eastern [d] 755
740
235
Other/multiracial [e]
725
390
365
Total responses
120,500
113,920
102,780
Total population
123,847
117,394
105,999
Notes: Totals greater than 100% due to multiple origin responses.2012 Canadian federal electoral redistribution riding boundaries.
Election results [ edit ] Graph of election results in Lethbridge (1914-1977), Lethbridge—Foothills, Lethbridge (1987-present) (minor parties that never got 2% of the vote or didn't run consistently are omitted)
Lethbridge, 1987–present [ edit ] Graph of election results in Lethbridge (1987-present) (minor parties that never got 2% of the vote or didn't run consistently are omitted)
2021 Canadian federal election
Party
Candidate
Votes
%
Expenditures
Conservative Rachael Harder 32,817
55.38
-10.07
$74,582.67
New Democratic Elaine Perez
11,386
19.22
+4.48
$649.51
Liberal Devon Hargreaves
8,928
15.07
+1.41
$22,887.05
People's Kimmie Hovan
4,097
6.91
+5.45
$3,238.34
Independent Kim Siever
1,179
1.99
–
$0.00
Christian Heritage Geoffrey Capp
566
0.96
-0.13
$7,470.57
Total valid votes/Expense limit
58,973 – – $118,112.55
Total rejected ballots
282
Turnout
66.13 -2.96
Eligible voters
89,663
Conservative hold
Swing
-7.28
Source: Elections Canada [6]
2019 Canadian federal election
Party
Candidate
Votes
%
Expenditures
Conservative Rachael Harder 40,713
65.79
+9.03
$81,336.37
New Democratic Shandi Bleiken
9,110
14.72
-5.78
none listed
Liberal Amy Bronson
8,443
13.64
-4.86
$39,899.72
Green Stephnie Watson
1,939
3.13
+0.56
none listed
People's Grant Hepworth
1,007
1.63
-
none listed
Christian Heritage Marc Slingerland
670
1.08
-0.23
none listed
Total valid votes/expense limit
61,882 99.46
Total rejected ballots
335 0.54
Turnout
62,217 69.09
Eligible voters
90,051
Conservative hold
Swing
+7.42
Source: Elections Canada [7] [8]
2015 Canadian federal election
Party
Candidate
Votes
%
Expenditures
Conservative Rachael Harder 32,321
56.76
+4.25
$120,662.32
New Democratic Cheryl Meheden
11,674
20.50
-9.45
$115,672.18
Liberal Mike Pyne
10,532
18.50
+9.36
$34,405.68
Green Kas MacMillan
1,461
2.57
-1.92
$2,377.70
Christian Heritage Geoffrey Capp
746
1.31
-2.61
$13,993.12
Rhinoceros Solly Krygier-Paine
209
0.37
–
–
Total valid votes/expense limit
56,943 100.00 $218,320.12
Total rejected ballots
158 0.28 –
Turnout
57,101 69.42 –
Eligible voters
82,225
Conservative hold
Swing
+6.85
Source: Elections Canada [9] [10]
2011 Canadian federal election
Party
Candidate
Votes
%
Expenditures
Conservative Jim Hillyer 27,173
56.51
-10.45
$72,625
New Democratic Mark Sandilands
13,097
27.24
+13.02
$36,703
Liberal Michael Cormican
4,030
8.38
-0.92
$23,067
Green Cailin Bartlett
2,095
4.36
-2.86
$0
Christian Heritage Geoffrey Capp
1,716
3.57
+1.26
$14,727
Total valid votes/expense limit
48,086 100.00
Total rejected ballots
307 0.63 +0.34
Turnout
48,393 54.20 +1
Eligible voters
89,280 – –
2008 Canadian federal election
Party
Candidate
Votes
%
Expenditures
Conservative Rick Casson 31,714
66.96
-0.34
$78,789
New Democratic Mark Sandilands
6,733
14.22
+0.52
$18,476
Liberal Michael Cormican
4,404
9.30
-1.95
$21,463
Green Amanda Swagar
3,420
7.22
+3.68
Christian Heritage Geoffrey Capp
1,094
2.31
-0.49
$13,529
Total valid votes/expense limit
47,365 100.00 $94,223
Total rejected ballots
138 0.29 +0.04
Turnout
47,503 53 -9
2004 Canadian federal election
Party
Candidate
Votes
%
Expenditures
Conservative Rick Casson 29,765
62.62
-12.22
$68,346
Liberal Ken Nicol 10,250
21.56
+4.62
$34,339
New Democratic Melanee Thomas
4,623
9.72
+3.97
$10,460
Green Erin Marie Matthews
1,262
2.65
+0.78
$32
Christian Heritage Ken Vanden Broek
1,079
2.27
–
$16,322
Marijuana Dustin Sobie
553
1.16
–
Total valid votes
47,532 100.00
Total rejected ballots
135 0.28 -0.07
Turnout
47,667 61.74 -0.19
Note: Conservative vote is compared to the total of Progressive Conservative and Canadian Alliance vote in 2000.
2000 Canadian federal election
Party
Candidate
Votes
%
Expenditures
Alliance Rick Casson 30,380
66.02
+10.49
$61,765
Liberal Vaughan Hartigan
7,797
16.94
-2.24
$10,339
Progressive Conservative Kimberly Denise Budd
4,062
8.82
-9.26
$3,506
New Democratic Garth Hardy
2,648
5.75
+0.38
$6,135
Green Don C. Ferguson
864
1.87
–
$1,324
Canadian Action Dan Lamden
264
0.57
-0.22
$739
Total valid votes
46,015 100.00
Total rejected ballots
163 0.35 +0.16
Turnout
46,178 61.93 +2.26
Note: Canadian Alliance vote is compared to the Reform vote in 1997.
1997 Canadian federal election
Party
Candidate
Votes
%
Expenditures
Reform Rick Casson 22,828
55.53
+2.97
$63,487
Liberal John McGee
7,887
19.18
-6.29
$47,656
Progressive Conservative Greg Weadick 7,436
18.08
+2.86
$40,649
New Democratic Victor Lough
2,211
5.37
+2.56
$3,877
Christian Heritage Nellie Slingerland
418
1.01
–
$1,944
Canadian Action J-C Lessard
326
0.79
–
$9,690
Total valid votes
41,106 100.00
Total rejected ballots
79 0.19
Turnout
41,185 59.67
Graph of election results in Lethbridge—Foothills (minor parties that never got 2% of the vote or didn't run consistently are omitted)
Lethbridge, 1914–1977 [ edit ] Graph of election results in Lethbridge (1914-1977) (minor parties that never got 2% of the vote or didn't run consistently are omitted)
Note: Progressive Conservative vote is compared to "National Government" vote in 1940 election. Social Credit vote is compared to New Democracy vote in 1940 election.
Note: "National Government" vote is compared to Conservative vote in 1935 election. New Democracy vote is compared to Social Credit vote in 1935 election.
Note: CCF vote is compared to Progressive vote in 1930 election.
Note: Progressive vote is compared to UFA vote in 1926 election.
Note: UFA vote is compared to Progressive vote in 1925 election.
See also [ edit ] References [ edit ]
^ Statistic includes all persons that did not make up part of a visible minority or an indigenous identity.
^ Statistic includes total responses of "Chinese", "Korean", and "Japanese" under visible minority section on census.
^ Statistic includes total responses of "Filipino" and "Southeast Asian" under visible minority section on census.
^ Statistic includes total responses of "West Asian" and "Arab" under visible minority section on census.
^ Statistic includes total responses of "Visible minority, n.i.e. " and "Multiple visible minorities" under visible minority section on census.
^ Statistics Canada : 2012^ Statistics Canada : 2012^ Government of Canada, Statistics Canada (October 26, 2022). "Census Profile, 2021 Census of Population" . www12.statcan.gc.ca . Retrieved July 2, 2023 . ^ Government of Canada, Statistics Canada (October 27, 2021). "Census Profile, 2016 Census" . www12.statcan.gc.ca . Retrieved July 2, 2023 . ^ Government of Canada, Statistics Canada (November 27, 2015). "NHS Profile" . www12.statcan.gc.ca . Retrieved July 2, 2023 . ^ "September 20, 2021 General Election Election Results" . Elections Canada . Retrieved September 22, 2021 .^ "List of confirmed candidates" . Elections Canada . Retrieved October 4, 2019 .^ "Official Voting Results" . Elections Canada. Retrieved September 22, 2021 .^ "October 19, 2015 Election Results — Lethbridge (Validated results)" . Elections Canada . October 23, 2015. Retrieved November 4, 2015 .^ Elections Canada – Preliminary Election Expenses Limits for Candidates Archived 2015-08-15 at the Wayback Machine ^ Pundits' Guide to Canadian Elections
External links [ edit ]

.svg)
 1914 representation order
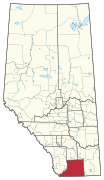 1924 representation order
 1933 representation order
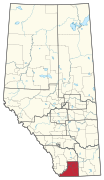 1952 representation order
 1966 representation order
 1976 representation order
 1987 representation order
 1996 representation order
 2003 representation order
 2013 representation order


