From Wikipedia, the free encyclopedia
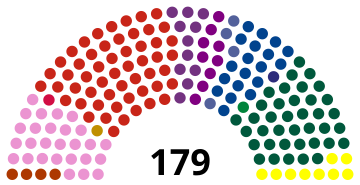
General elections were held in Denmark on 8 September 1987.[1] Although the Social Democratic Party remained the largest in the Folketing with 54 of the 179 seats, the Conservative People's Party-led coalition government was able to continue. Voter turnout was 87% in Denmark proper, 69% in the Faroe Islands and 45% in Greenland.[2]
Results[edit]
 |
|---|
| Party | Votes | % | Seats | +/– |
|---|
| Denmark proper |
|---|
| Social Democrats | 985,906 | 29.32 | 54 | –2 |
| Conservative People's Party | 700,886 | 20.84 | 38 | –4 |
| Socialist People's Party | 490,176 | 14.58 | 27 | +6 |
| Venstre | 354,291 | 10.54 | 19 | –3 |
| Danish Social Liberal Party | 209,086 | 6.22 | 11 | +1 |
| Centre Democrats | 161,070 | 4.79 | 9 | +1 |
| Progress Party | 160,461 | 4.77 | 9 | +3 |
| Christian People's Party | 79,664 | 2.37 | 4 | –1 |
| Common Course | 72,631 | 2.16 | 4 | New |
| Left Socialists | 46,141 | 1.37 | 0 | –5 |
| The Greens | 45,076 | 1.34 | 0 | New |
| Communist Party of Denmark | 28,974 | 0.86 | 0 | 0 |
| Justice Party of Denmark | 16,359 | 0.49 | 0 | 0 |
| Humanist Party | 5,675 | 0.17 | 0 | New |
| Socialist Workers Party | 1,808 | 0.05 | 0 | 0 |
| Communist Party of Denmark/Marxist–Leninists | 987 | 0.03 | 0 | 0 |
| Independents | 3,366 | 0.10 | 0 | 0 |
| Total | 3,362,557 | 100.00 | 175 | 0 |
|
| Valid votes | 3,362,557 | 99.21 | |
|---|
| Invalid/blank votes | 26,644 | 0.79 | |
|---|
| Total votes | 3,389,201 | 100.00 | |
|---|
| Registered voters/turnout | 3,907,454 | 86.74 | |
|---|
| Faroe Islands |
|---|
| People's Party | 6,411 | 28.84 | 1 | 0 |
| Social Democratic Party | 5,486 | 24.68 | 1 | +1 |
| Union Party | 5,345 | 24.05 | 0 | –1 |
| Republican Party | 3,478 | 15.65 | 0 | 0 |
| Self-Government | 1,070 | 4.81 | 0 | 0 |
| Progress Party | 438 | 1.97 | 0 | New |
| Total | 22,228 | 100.00 | 2 | 0 |
|
| Valid votes | 22,228 | 99.30 | |
|---|
| Invalid/blank votes | 157 | 0.70 | |
|---|
| Total votes | 22,385 | 100.00 | |
|---|
| Registered voters/turnout | 32,484 | 68.91 | |
|---|
| Greenland |
|---|
| Siumut | 6,944 | 43.28 | 1 | 0 |
| Atassut | 6,627 | 41.30 | 1 | 0 |
| Inuit Ataqatigiit | 2,001 | 12.47 | 0 | 0 |
| Polar Party | 474 | 2.95 | 0 | New |
| Total | 16,046 | 100.00 | 2 | 0 |
|
| Valid votes | 16,046 | 94.50 | |
|---|
| Invalid/blank votes | 934 | 5.50 | |
|---|
| Total votes | 16,980 | 100.00 | |
|---|
| Registered voters/turnout | 37,800 | 44.92 | |
|---|
| Source: Nohlen & Stöver |
See also[edit]
References[edit]


